BlogIndustry Insights
Automated Debugging: From Classic Tools to LLM‑Driven Scientific Debugging

BridgeApp Team
13 min read

Every engineering team has lived this scenario: a critical service starts throwing errors at 2 AM, and the on-call engineer spends hours sifting through logs, reproducing failures, and tracing execution paths before finding a one-line fix. Automated debugging aims to compress that entire cycle from hours or days into minutes, using a combination of tests, static analysis, and AI-assisted analysis to locate and fix software issues with minimal human toil. This guide walks through the full landscape, from foundational debugging techniques to the latest LLM-driven scientific debugging systems, with practical advice for teams ready to adopt.
Key Takeaways
Automated debugging is evolving fast. Here is what matters most from this article:
- Automated debugging uses tools to locate and fix software issues across every stage of the development lifecycle, from coding and testing to CI/CD pipelines and production incident response. It is fundamentally different from manual debugging because it replaces repetitive human steps with orchestrated, intelligent workflows.
- Traditional debugging tools like IDE debuggers, dynamic analysis tools, and log analyzers now combine with AI-powered automated debugging systems to dramatically reduce mean time to resolution. Industry case studies show MTTR reductions of 60–80%.
- Explainable automated debugging and automated scientific debugging driven by large language models mirror the human hypothesis–experiment–observation loop, and 70% of developers find these explanations important for trusting machine-generated patches.
- Concrete adoption works best incrementally: start with CI regression triage and log correlation, then layer in fault localization, automated program repair, and LLM-driven suggestions with regular reviews.
- Platforms like BridgeApp can orchestrate multi-agent, LLM-based automated debugging flows while keeping humans in the loop, with agents that stop at "waiting for merge" so a human engineer always decides what reaches production.
What Is Automated Debugging?
In software engineering and computer science, automated debugging refers to methods and systems that take over parts of the bug-finding, diagnosis, localization, and repair process. Where manual debugging relies on a developer setting breakpoints, inserting print statements, and stepping through program execution line by line, automated debugging systems use debugging tools, scripts, and AI agents to detect, localize, and sometimes repair bugs with minimal human intervention. The distinction is not that automation replaces thinking but that it replaces the repetitive, low-signal work that consumes most debugging time.
Automated debugging is a combination of tests, static analysis, and AI-assisted analysis working together. The key activities that can be automated include log triage and filtering, test case generation and minimization, fault localization to pinpoint faulty code, execution synthesis to reproduce failures from incomplete bug reports, patch suggestion through automated program repair, and regression checking to verify that fixes do not break other functionality.
These capabilities connect directly to all major stages of the SDLC. During coding, integrated development environments can surface potential bugs in real time. During testing, automated tools run and diagnose failures. In CI/CD pipelines, failing commits trigger automated triage. In production environments, observability tools correlate anomalies and kick off root cause analysis. Automated debugging can be applied at every development lifecycle stage. By late 2020s, adoption has accelerated sharply due to large language models, cloud-native architectures, and the sheer volume of logs and telemetry generated by distributed systems.
Why Automated Debugging Matters in Modern Development
Software complexity has grown exponentially. Microservices, serverless functions, event-driven architectures, and polyglot stacks mean that a single user request can traverse dozens of services across multiple regions. The cost of poor software quality in the US reached USD 2.41 trillion in 2022, a figure that underscores how deeply bugs affect revenue, trust, and operational stability. Automated debugging could save the US $2.41 trillion by addressing these quality failures systematically.
Automated debugging shortens the debugging process, reduces manual toil, and supports faster release cycles in agile workflows and DevOps cultures. Here are the concrete business outcomes teams report:
- Lower incident MTTR. Toyota Motor North America achieved an 80% reduction in MTTR after deploying AI/ML-based monitoring and automated root-cause tools.
- Fewer production rollbacks and more stable sprint velocity.
- Automated debugging improves code quality by catching edge-case defects early, before they reach production environments.
- It reduces developer burnout by offloading repetitive troubleshooting tasks, freeing engineers for design and architecture work.
- Automated debugging significantly reduces the time spent on manual code inspection, with studies suggesting it can save up to 30% of development time.
- Automated debugging tools can reduce software development costs by 30% through earlier defect detection and fewer post-release fixes.
- Automated debugging improves software quality by reducing oversight and enhances resource allocation for manual debugging tasks that genuinely require human judgment.
Automation does not replace engineers. It lets them focus on hard design, root cause analysis, and decision-making instead of repetitive log scraping and reruns. Automated debugging aims to improve software quality and reduce costs simultaneously.
Core Concepts: From Debugging Process to Debugging Tools
The classic debugging process follows a predictable sequence: reproduce the failure, localize the fault, understand the root cause, fix the defect, validate the fix, and document what happened. Automation is most effective in the reproduce, localize, and validate steps, which tend to be the most time-consuming and repetitive.
Debugging tools fall into well-known categories:
- IDE debuggers (Visual Studio, IntelliJ IDEA) for stepping through source code and setting conditional breakpoints
- Logging frameworks and observability platforms (ELK stack, OpenTelemetry) for gathering and correlating telemetry
- Static analysis and static code analyzers that help detect errors without executing the code, catching syntax errors, security vulnerabilities, and violations of coding standards
- Dynamic analysis tools that monitor software during execution to catch bugs, including memory checkers and race detectors
- Profilers for identifying performance hotspots and memory leaks
- Test frameworks for unit tests, integration tests, and fuzzing
Automated debugging layers orchestration and intelligence on top of these tools. For example, scripts can automatically rerun failing tests with different inputs, or agents can correlate logs across services to surface the root cause. Automated debugging supports CI/CD pipelines to enable instant code testing, so that failures are diagnosed immediately rather than sitting in a queue.
The relationship between testing and debugging is worth clarifying: testing finds failures; debugging, increasingly automated, finds and repairs underlying defects. They are complementary, not interchangeable.
Types of Automated Debugging Systems
Automated debugging systems are not single utilities but end-to-end or semi-autonomous pipelines that orchestrate multiple steps. Here are the major archetypes:
- CI-integrated bug finders that run during continuous integration, automatically flagging regressions and sometimes suggesting repairs
- Production incident triage bots that correlate metrics, logs, and traces to propose root causes during live incidents
- Auto-repair pipelines that generate candidate patches, validate them against test suites, and present them for human review
- IDE-integrated assistants that offer real-time hypothesis generation, lint and repair suggestions, and patch generation inside a developer's editor
- Multi-agent debugging platforms where specialized agents coordinate detective-style workflows: triage, hypothesis, experimentation, patch, review, and merging
These systems differ in autonomy. Suggestive systems recommend fixes and require human diagnosis. Semi-automatic systems generate patches for review. Fully automatic systems apply fixes under strict constraints, mainly in low-risk domains like feature flags or non-critical services.
Deployment environments vary: local developer machines, build servers, cloud-hosted services plugged into GitHub or GitLab, or embedded in platforms like BridgeApp that provide orchestration, governance, and agent collaboration out of the box.
Fault Localization and Dynamic Analysis
Fault localization is the process of identifying which statements, methods, or components are most likely to contain a bug. It is the step that often consumes the most time in manual debugging, and it is the step where automation delivers the highest leverage. Fault localization identifies the exact location of a bug by analyzing execution data.
Spectrum-based fault localization uses coverage data from automated testing. The approach compares which code lines were executed by passing tests versus failing tests and assigns a suspiciousness score to each line. Lines executed predominantly by failing tests rank higher. Automation can increase debugging accuracy by 20% or more when these rankings guide developer attention.
Dynamic analysis tools play a critical role by observing program behavior at runtime. Memory checkers like Valgrind and AddressSanitizer detect memory leaks and buffer overflows. Race detectors flag concurrency issues. Tracing systems reconstruct execution flows across service boundaries.
Consider a concrete micro-example: a Java web service processing API requests starts throwing NullPointerExceptions on certain inputs. Automated tests fail, and spectrum-based localization identifies a method responsible for parsing request headers as highly suspicious. Dynamic analysis confirms that a specific variable within that method is null when a particular header is missing. The localization system ranks the offending code line at the top, and the engineer can immediately see where to add a null-check. Without automation, this process could take hours of reading logs and adding print statements.
Program Slicing, Delta Debugging, and Execution Synthesis
Automated debugging research since the 1990s has contributed specific techniques that are now embedded in modern tools. Three of the most impactful are program slicing, delta debugging, and execution synthesis.
Program slicing narrows down parts of code to find issues by isolating only the statements and data flows relevant to a particular variable or output. If a developer is investigating why a return value is incorrect, a program slice strips away everything unrelated, reducing a 10,000-line file to the 40 lines that actually influence the result. Research published in 2024 showed that program slicing reduced median repair time for the automated repair tool TBar from approximately 80 minutes to under 18 minutes, without degrading repair quality.
Delta debugging breaks test cases into smaller parts to isolate bugs. It systematically reduces failing inputs or configuration differences to a minimal failure-inducing case. This technique is especially useful for browser bugs, compiler crashes, or any situation where the original failing input is large and complex.
Execution synthesis helps reproduce bugs using detailed bug reports, logs, and stack traces. It constructs a concrete execution path that deterministically triggers the failure, which is crucial when users cannot provide exact reproduction steps.
Here is a short scenario combining these techniques: a REST API returns intermittent 500 errors. The team collects request and response histories from the observability platform. Execution synthesis reconstructs the exact request sequence that triggers the failure. Delta debugging reduces it from a 15-step workflow to three essential API calls. Program slicing then isolates the relevant code path in the handler, revealing a race condition in a shared cache. What could have taken a day of manual debugging becomes a structured, 30-minute investigation.
Automated Program Repair and Patch Generation
Automated program repair, or APR, refers to techniques that propose code changes to fix failing tests or crashes without humans writing the patch manually. APR approaches fall into three broad categories:
- Template-based fixes apply known repair patterns, such as inserting null-checks, correcting off-by-one errors, or fixing boundary conditions. Tools like TBar use curated fix templates and have been benchmarked extensively. On the Defects4J benchmark, TBar correctly fixed 43 bugs in a standard setup and up to 74 bugs under perfect localization conditions.
- Search-based patch synthesis explores candidate edits guided by test results, sometimes using genetic programming or rule applications.
- ML and LLM-based code generation uses models trained or prompted to propose fixes given buggy code, test failures, and context. These methods generate many candidate patches, though a lower proportion tend to be compilable or semantically correct compared to template-based approaches.
APR systems integrate naturally into CI: when a new regression appears, the system attempts candidate fixes and validates them against the full test suite. Automated debugging improves software security by applying known repair patterns to common vulnerability classes.
The key limitation is overfitting. A patch might pass all existing tests but be semantically wrong, introducing subtle regressions or violating unstated requirements. This is why human review remains essential. Explainable automated debugging seeks to pair every generated patch with reasoning about root cause and behavioral impact, not just a diff.
Explainable Automated Debugging and Scientific Debugging
Explainable automated debugging systems provide transparent, human-readable rationales alongside their outputs. Instead of presenting an engineer with a cryptic patch and no context, these systems explain why they believe a particular code line is faulty, what evidence supports the hypothesis, and what alternative explanations were ruled out.
The scientific debugging model follows the classic cycle: hypothesis, prediction, experiment, observation, conclusion. Empirical studies since the 1970s have shown that experienced developers naturally debug this way. The innovation in recent years is automating this loop with LLMs.
AutoSD, published in Empirical Software Engineering, uses LLMs plus a debugger interface to propose automated scientific debugging. Given buggy code and a failing test, the system generates hypotheses, executes experiments via the debugger or targeted test code, observes outcomes, and iterates until convergence. AutoSD can achieve competitive repair results using LLMs while providing explanations that developers actually trust. When the system indicated high confidence via its internal confidence token, accuracy for plausible patches rose to approximately 89%, versus 82% without.
The trade-off is speed: AutoSD takes about 9 minutes 22 seconds per bug to generate 10 patches, versus roughly 2 minutes for a non-explainable LLM baseline. But 70% of developers find explanations important for automated debugging, and in human studies, participants reported that explanations improved their judgment of patch correctness with little or no time penalty.
A useful way to think about the difference: black-box APR gives you a patch and says "this passes your tests." Scientific, explainable APR gives you a patch and says "here is the hypothesis I formed, the experiments I ran, the evidence I gathered, and why I believe this fix addresses the root cause." The latter approach builds trust, supports auditability, enables onboarding, and meets compliance requirements in regulated domains like finance or healthcare. This is why researchers and practitioners propose automated scientific debugging as the next standard for professional teams.
Large Language Models in Automated Debugging
Large language models have shifted automated debugging from niche academic research to widely available capabilities in IDEs and cloud platforms. By 2023-2026, models in the GPT-4 class can read source code, test failures, stack traces, and bug reports in natural language, then propose hypotheses, debugger commands, and patches aligned with how different components interact.
LLMs bring flexible reasoning across programming languages and the ability to ingest mixed prose and code. AI-driven debugging tools can predict potential issues in new code commits by analyzing patterns learned from vast training corpora. AI/ML advancements are driving the evolution of automated debugging tools, and large language models can improve automated debugging explanations by generating human-readable summaries of what was tried and why conclusions were reached.
Reinforcement learning from human feedback and tool-calling APIs allow LLMs to integrate static analyzers, test runners, and standalone debuggers into their reasoning loop. The model calls a tool, reads the result, updates its hypothesis, and iterates. This connects directly to the scientific debugging paradigm, where LLMs both drive the hypothesis loop and generate the explanations.
Weaknesses are real. LLMs hallucinate, inventing behavior not consistent with actual code. They can be overconfident about incorrect diagnoses. They struggle with deeply concurrent systems and unknown runtime environments. Sandboxed execution and verification through automated testing remain crucial. AI/ML will enhance automated debugging tools significantly, but they will not eliminate the need for human oversight.
Debugging Automation in Distributed Systems
Distributed systems present unique debugging challenges: partial failures, clock skew, network partitions, and the difficulty of correlating logs across dozens of microservices and regions. In these environments, human-only manual debugging is too slow, making automation an operational necessity rather than a luxury.
Automated debugging tools leverage traces from frameworks like OpenTelemetry, log aggregation, and metric dashboards to reconstruct failing execution paths automatically. Continuous monitoring detects anomalies and performance degradation in real-time, feeding alerts into automated triage pipelines.
Automated root cause analysis features highlight anomalous services, spikes in error codes, or suspicious deployment events around the time of an incident. For example, a Fortune 500 retailer instrumenting 800+ services reduced MTTR from 47 minutes to 12 minutes, a 74% improvement, in the first quarter after full instrumentation.
Consider a payment service outage in a cloud-native architecture. Automated systems correlate a specific Kubernetes rollout with increased latency and error rates. The debugging pipeline identifies that the new container image introduced a dependency version mismatch, causing timeouts in a downstream database connection pool. Traces show exactly which service calls failed and when. The system proposes rolling back to the previous image and flagging the dependency for review. What would have required hours of manual log correlation is completed in minutes.
Integrating Automated Debugging into Agile Workflows
Agile workflows like Scrum and Kanban expect frequent, small releases and fast feedback loops. Automated debugging slots naturally into this cadence. Failing story tests trigger automatic triage. Pre-merge checks run APR attempts. Post-deployment monitors feed alerts into chatops channels. It enhances CI/CD efficiency by diagnosing test failures immediately upon code commits.
Practical recommendations for agile teams:
- Keep debugging automations version-controlled alongside application code
- Review automation outputs during sprint retrospectives
- Track impact on cycle time, defect rates, and developer satisfaction
- Share automation dashboards across QA, developers, and SREs to reduce "works on my machine" friction
Dynamic workflows in agile development complicate automated debugging implementation, so teams should treat automated debugging systems as part of their toolchain with explicit ownership, backlog items for improving rules, and measurable KPIs. Automated debugging can lower software maintenance costs by reducing post-release fixes that disrupt sprint planning.
Key Debugging Tools That Enable Automation
Most automated debugging pipelines are built on top of battle-tested debugging tools rather than replacing them. Here are the categories and how they participate in automation:
- IDE debuggers (Visual Studio, IntelliJ IDEA): integrated development environments include built-in debugging tools with advanced debugging features like conditional breakpoints and watch expressions. They can be scripted via APIs for automated workflows.
- Standalone debuggers (GDB, LLDB): the GNU debugger and similar tools offer remote debugging features and command line interfaces that automated systems can drive programmatically. Many automated tools offer remote debugging features through these interfaces.
- Logging platforms (ELK stack, Splunk): aggregate and correlate logs, triggering alerts on new stack trace patterns.
- Static analyzers (SonarQube, Clang-Tidy): code analysis tools that run automatically in CI, catching consistent coding styles violations, security vulnerabilities, and potential bugs before code is merged.
- Dynamic analysis tools (Valgrind, sanitizers): instrument test executions to detect memory leaks, race conditions, and undefined behavior.
- Profilers: identify performance hotspots and resource bottlenecks that may indicate deeper defects.
Tool interoperability and scriptability through CLI, APIs, and webhooks are crucial to building robust automated debugging systems. Without scriptable interfaces, automation breaks down into manual copy-paste workflows.
Designing an Automated Debugging Process for Your Team
Before adding automation, map your current debugging process. Teams that skip this step end up with brittle, one-off scripts that break at the first infrastructure change.
Here is a practical step-by-step design:
- Identify high-cost debugging pain points. Where does your team spend the most time? Log correlation? Reproduction? Localization?
- Choose where automation can help. Triage, reproduction, localization, and repair each have different tool requirements.
- Pick appropriate debugging tools and debugging techniques that match your stack and programming languages.
- Define success metrics. Average bug reproduction time, MTTR, false positive rate, developer satisfaction.
Create a standardized bug report template that captures environment details, reproduction steps, logs, and links to failing test scripts. This template becomes the input for automated workflows and LLMs. A well-structured bug report is worth more than any individual tool.
Implement automation incrementally. Start with automatic log correlation. Then add automated test case minimization. Later, introduce APR or LLM-driven suggestions. At each stage, review outputs with the team and adjust. The application development process benefits from this gradual approach.
Document everything and train engineers so they understand how the automation works and when to override or disable it. Automation that engineers do not trust will be bypassed.
Evaluating Automated Debugging Tools and Platforms
Choosing automated debugging tools requires more than reading marketing materials. Here is a practical evaluation framework:
- Language and framework support: does the tool work with your programming languages and scripting languages?
- Integration with existing CI/CD and observability stacks: can it plug into your version control system, build server, and alerting pipeline?
- Quality of explanations: does it provide explainable automated debugging outputs, or just a raw patch?
- False-positive rate: how often does it flag non-issues or generate incorrect patches?
- Performance overhead: does it slow down builds or test runs unacceptably? Some tools present a steeper learning curve for integration.
- Debugging capabilities depth: does it support static analysis, dynamic analysis, or both?
- Licensing costs versus value delivered
Run a time-boxed pilot on real bug histories, ideally the last three to six months of bug reports in a production service. Measure impact on MTTR, user satisfaction, and developer confidence. Prioritize tools that can operate safely in production via read-only access or sandboxed execution.
For organizations standardizing on platforms like BridgeApp, it is often more effective to integrate debugging automations into a centralized orchestration layer than to maintain isolated scripts scattered across repositories.
Human in the Loop: Balancing Automation and Expertise
Debugging is as much about understanding software systems and business rules as it is about manipulating code. Full automation is rarely appropriate for critical changes. Human error in patch review is a real risk, but so is blind trust in automated output.
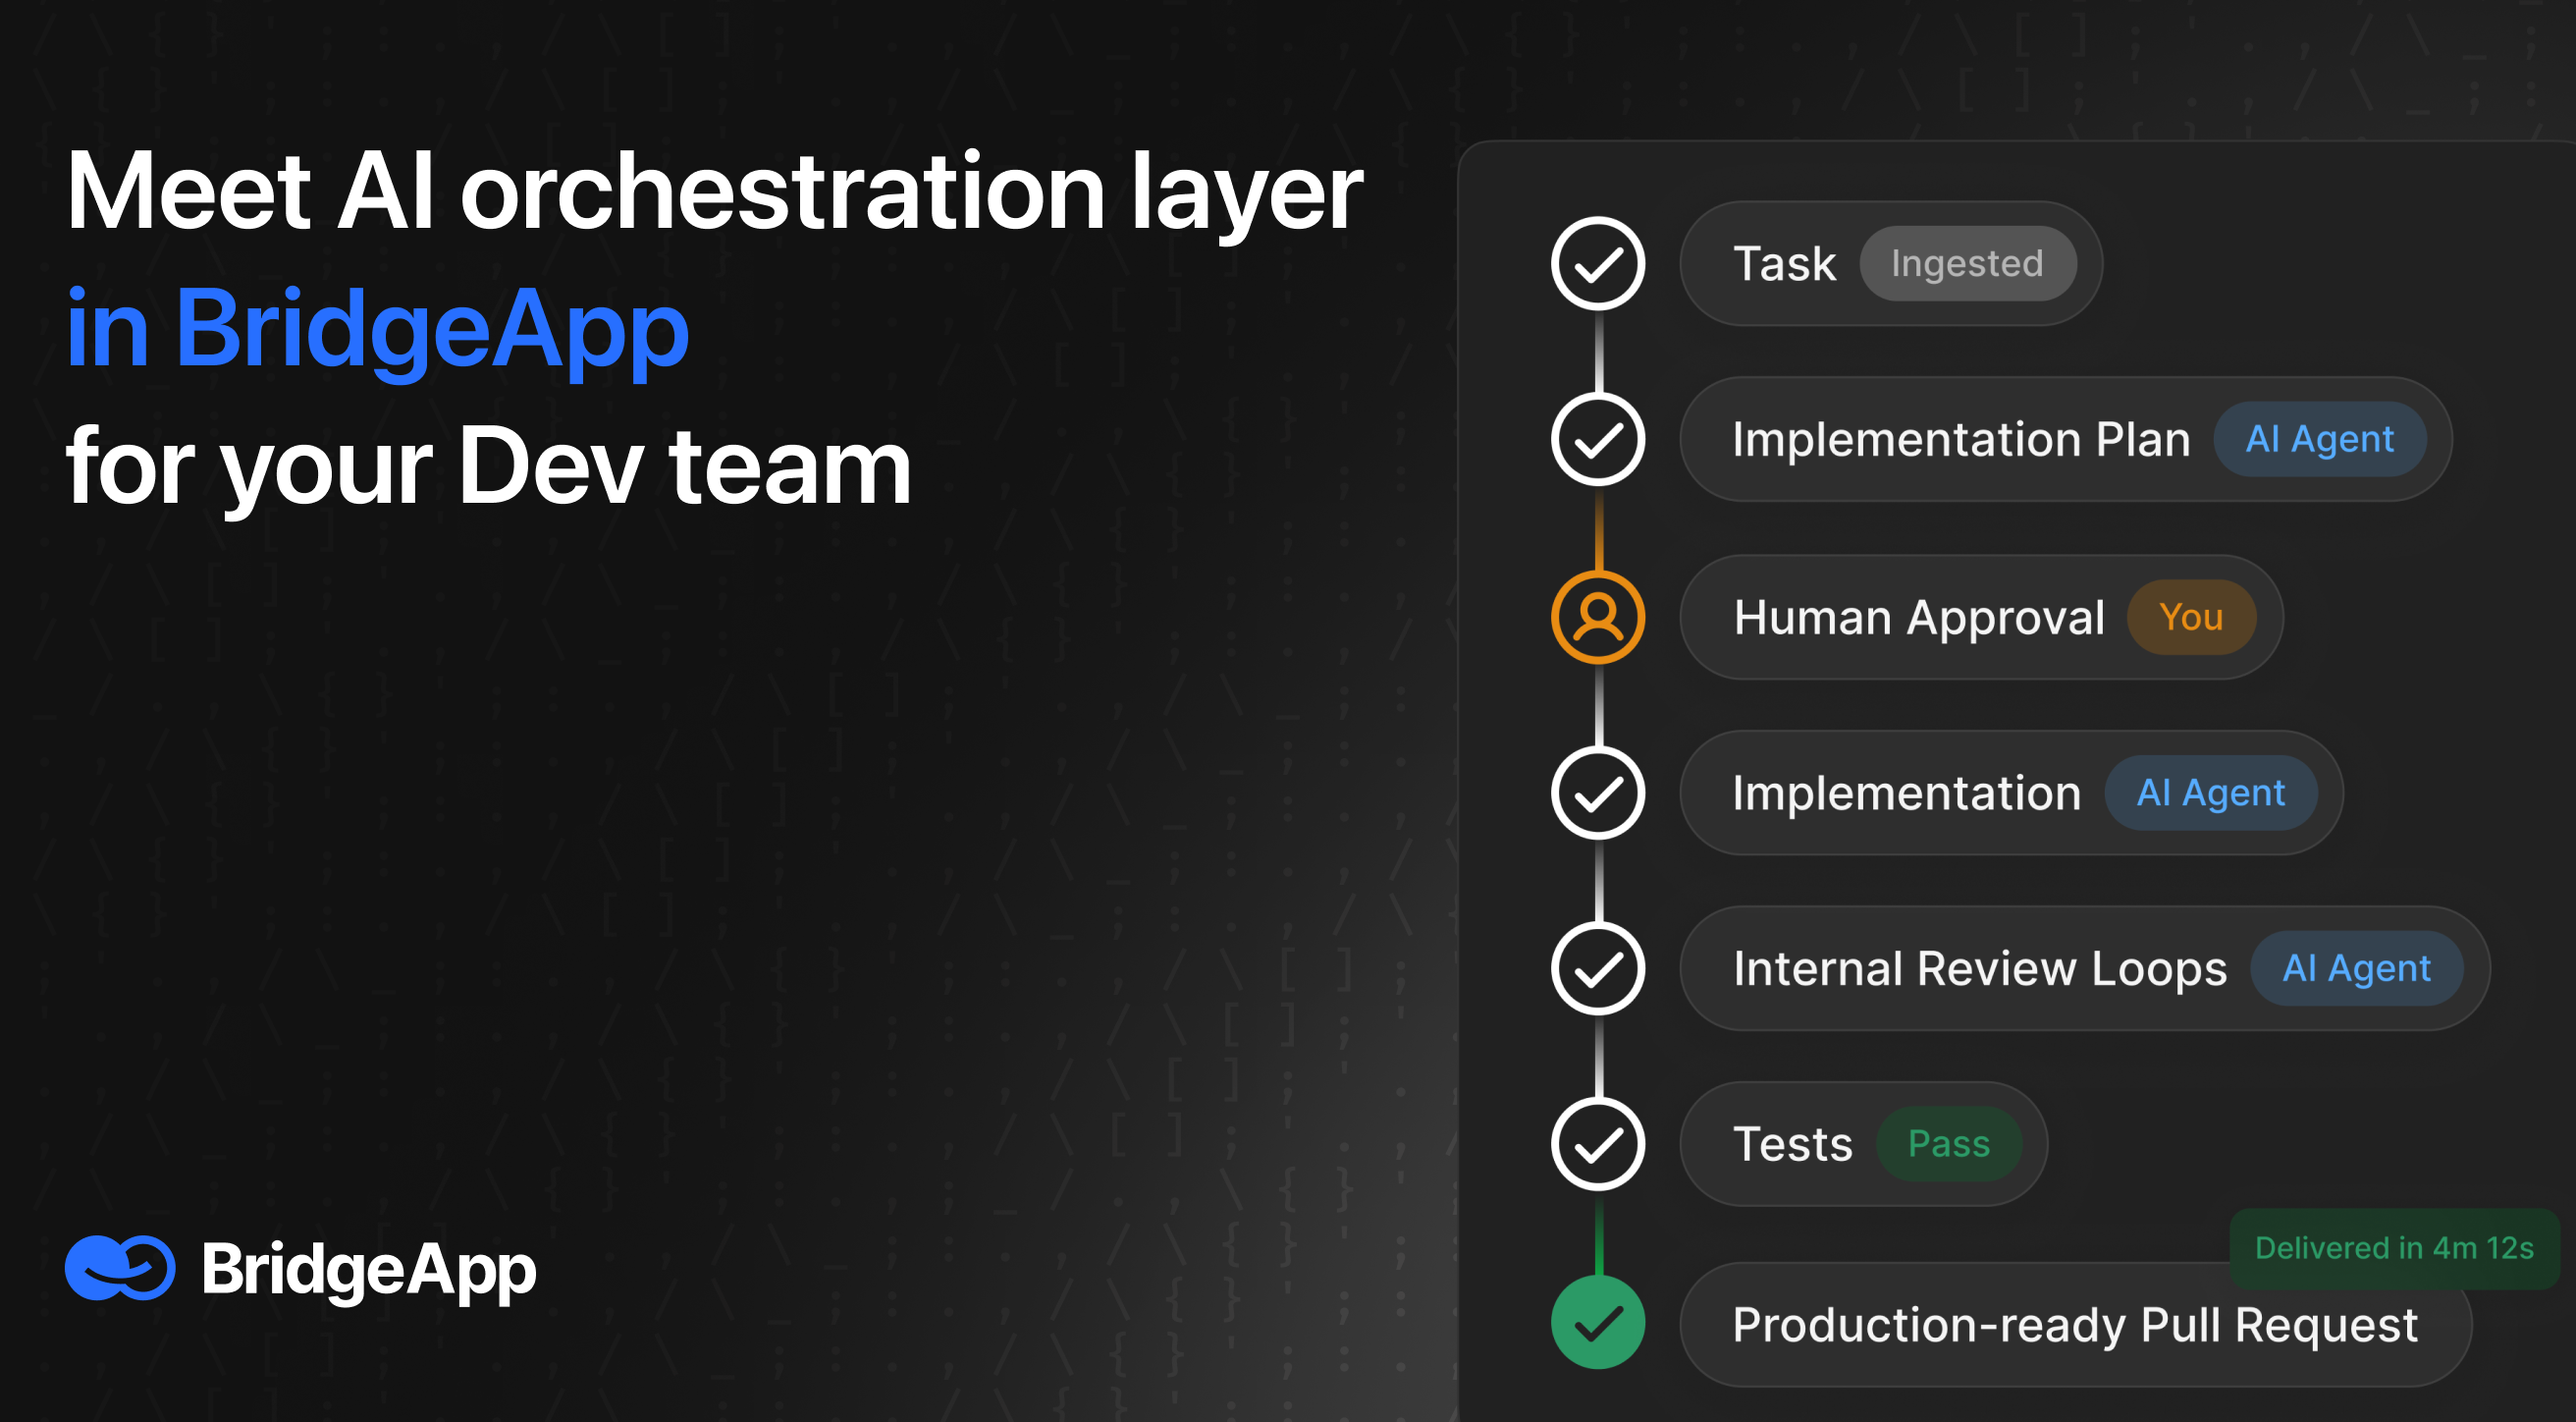
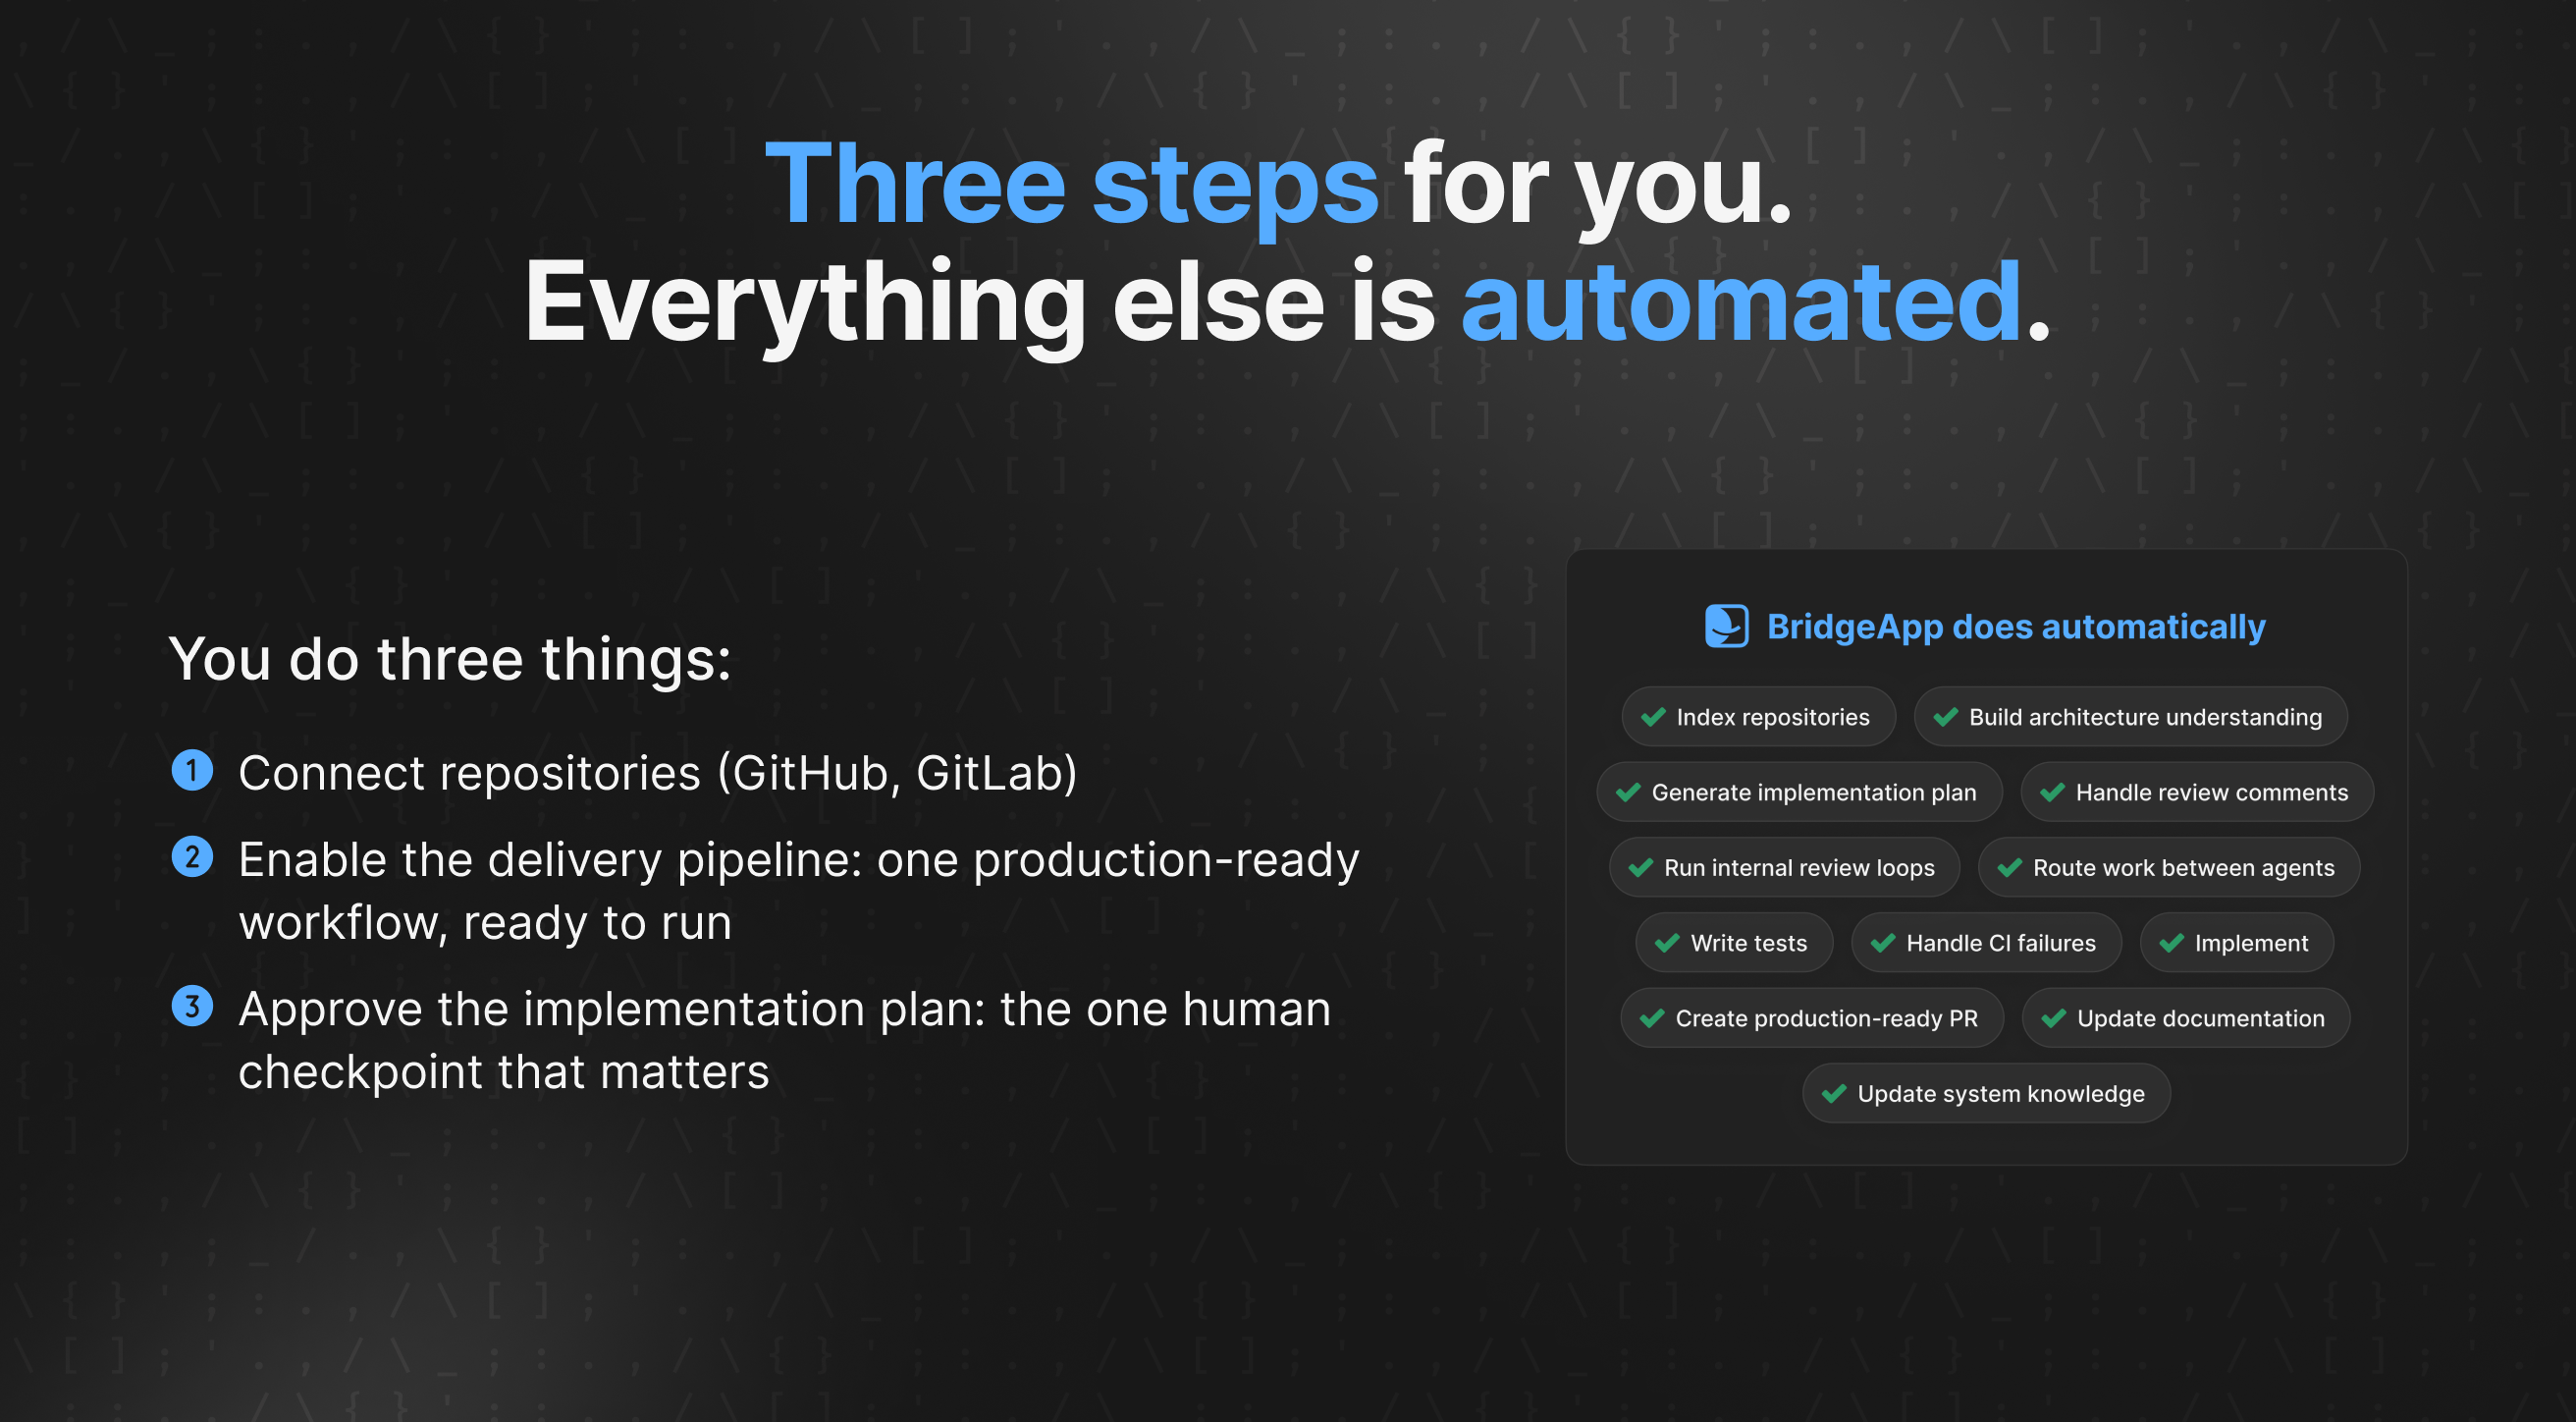
Effective human-in-the-loop patterns include:
- Automated tools propose hypotheses and patches; engineers approve or refine them
- Production rollouts go through change management with explicit sign-off
- Regression tests run automatically, but deployment decisions remain human
Risks of over-reliance include erosion of manual debugging skills, blind trust in tool output, and failure to notice context that tools miss, such as security or compliance implications. Teams should maintain governance practices: code review policies for machine-generated patches, audit logs for automated actions, and explicit guardrails about what automation may or may not modify.
Multi-agent systems like those orchestrated in BridgeApp are intentionally designed to stop at "waiting for merge," leaving the final decision to a human reviewer. This is not a limitation but a design choice that enables developers to remain accountable for what reaches production.
Case Study: Automated Debugging in a CI/CD Pipeline
A backend service in a fintech company introduces a regression during a routine feature addition. The CI pipeline detects the failure: three unit tests and one integration test fail after the latest commit.
The pipeline automatically collects failing logs, stack traces, and coverage data. Dynamic analysis tools instrument the failing tests, revealing that a newly added method is writing to a shared data structure without proper synchronization, causing intermittent failures. Fault localization ranks the new method and two lines in an existing utility class as the most suspicious.
An LLM-based agent reviews the test failures, the localization results, and the recent diff. It forms a hypothesis: the developer introduced a race condition by reusing a non-thread-safe cache in a concurrent handler. The agent runs additional targeted test scripts to confirm the hypothesis, observes the expected failures under concurrent load, and proposes a patch that wraps the cache access in a synchronized block. The scientific debugging presentation attached to the patch includes the hypothesis, the experiments run, and the evidence gathered.
The engineer reviews the proposed change, notices that a broader refactoring would be cleaner, makes a minor adjustment, and re-runs the pipeline. All checks pass. The merge happens within hours, not days. The entire flow from failing test to merged fix took less than a morning, with the engineer spending roughly 20 minutes on review rather than hours on investigation.
BridgeApp and Multi‑Agent Automated Debugging
BridgeApp is a platform that lets engineering teams orchestrate custom AI agents, including coding and debugging-focused agents, across their projects and repositories. It provides the connective tissue between task management, documentation, code intelligence, and agent execution that standalone debugging tools lack.
Magic Coder by BridgeApp can act as a debugging specialist: inspecting codebases, analyzing failing tests, correlating bug reports, and proposing fixes within a controlled, auditable workflow. Because it understands not just the code but also the task context, discussions, documentation, and organizational standards in a connected workspace, its debugging output is grounded in how the team actually works.
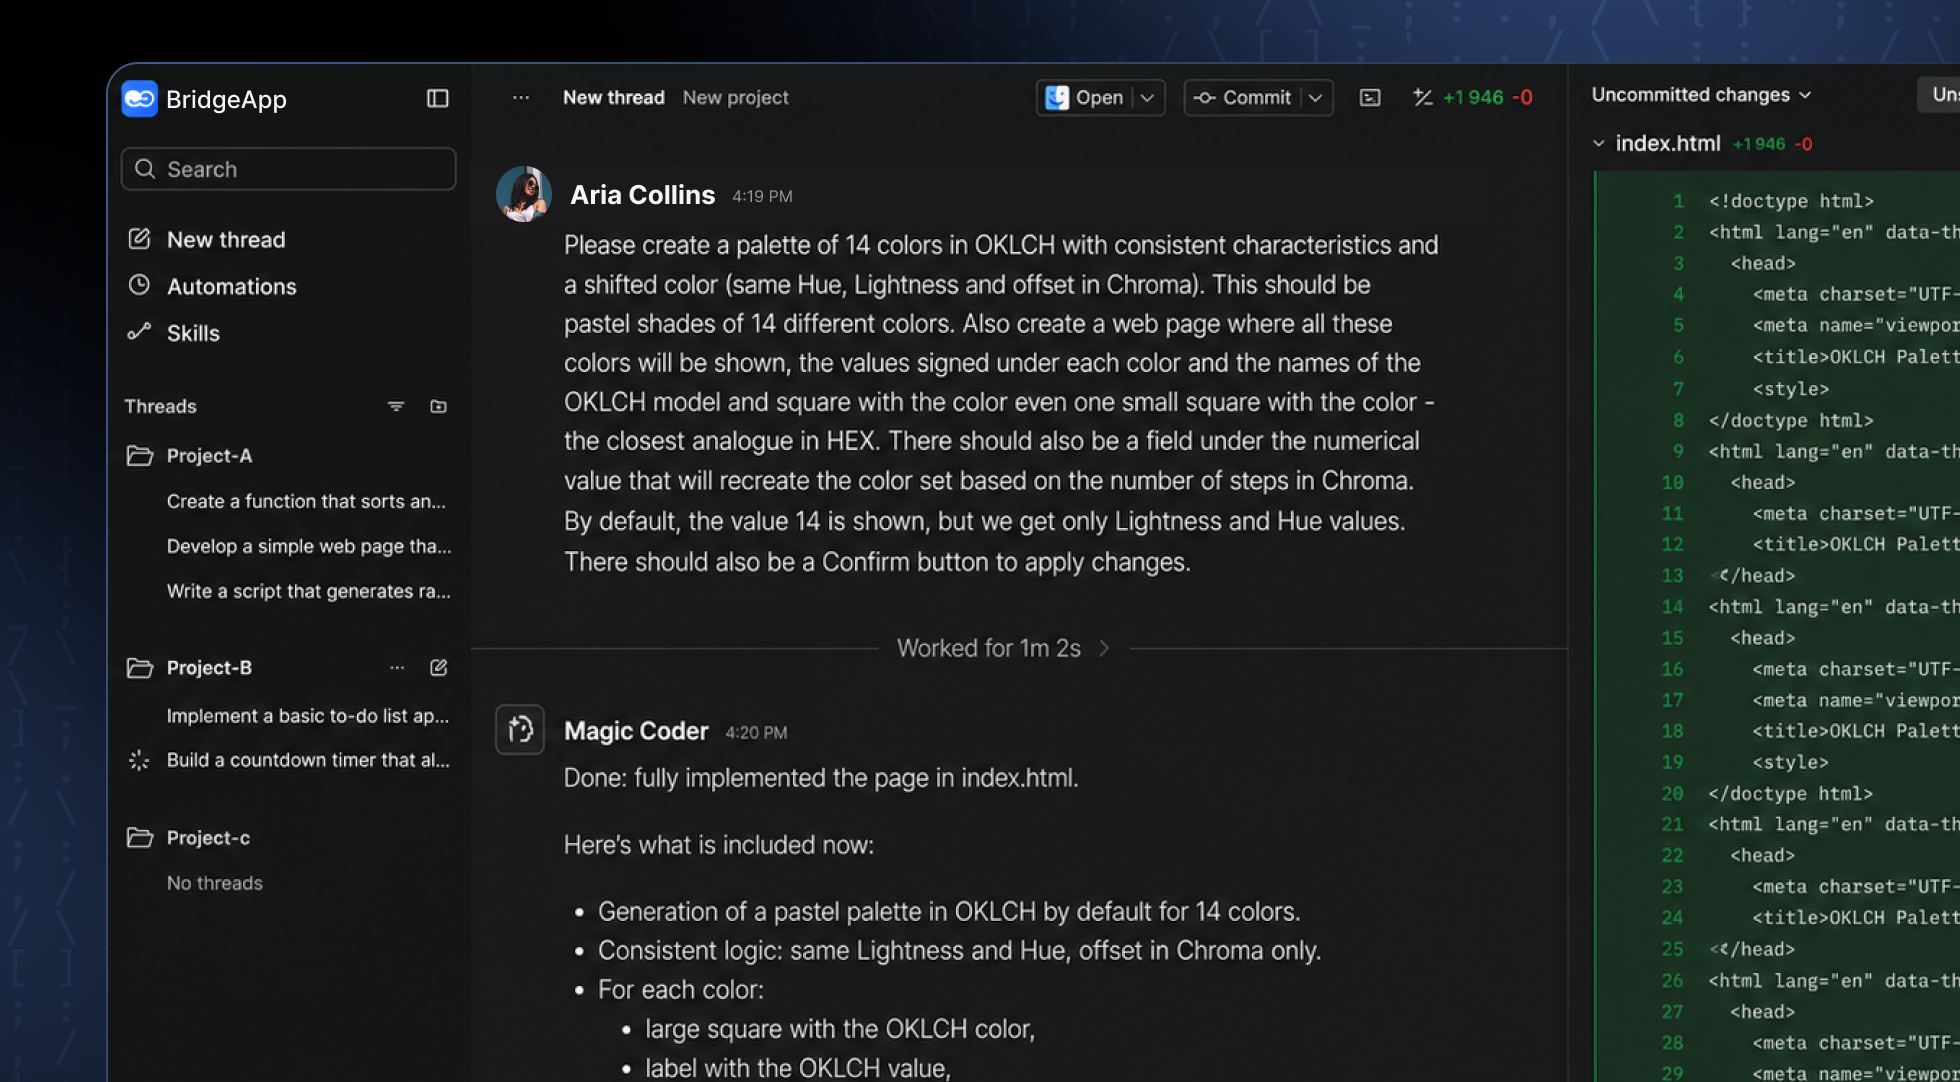
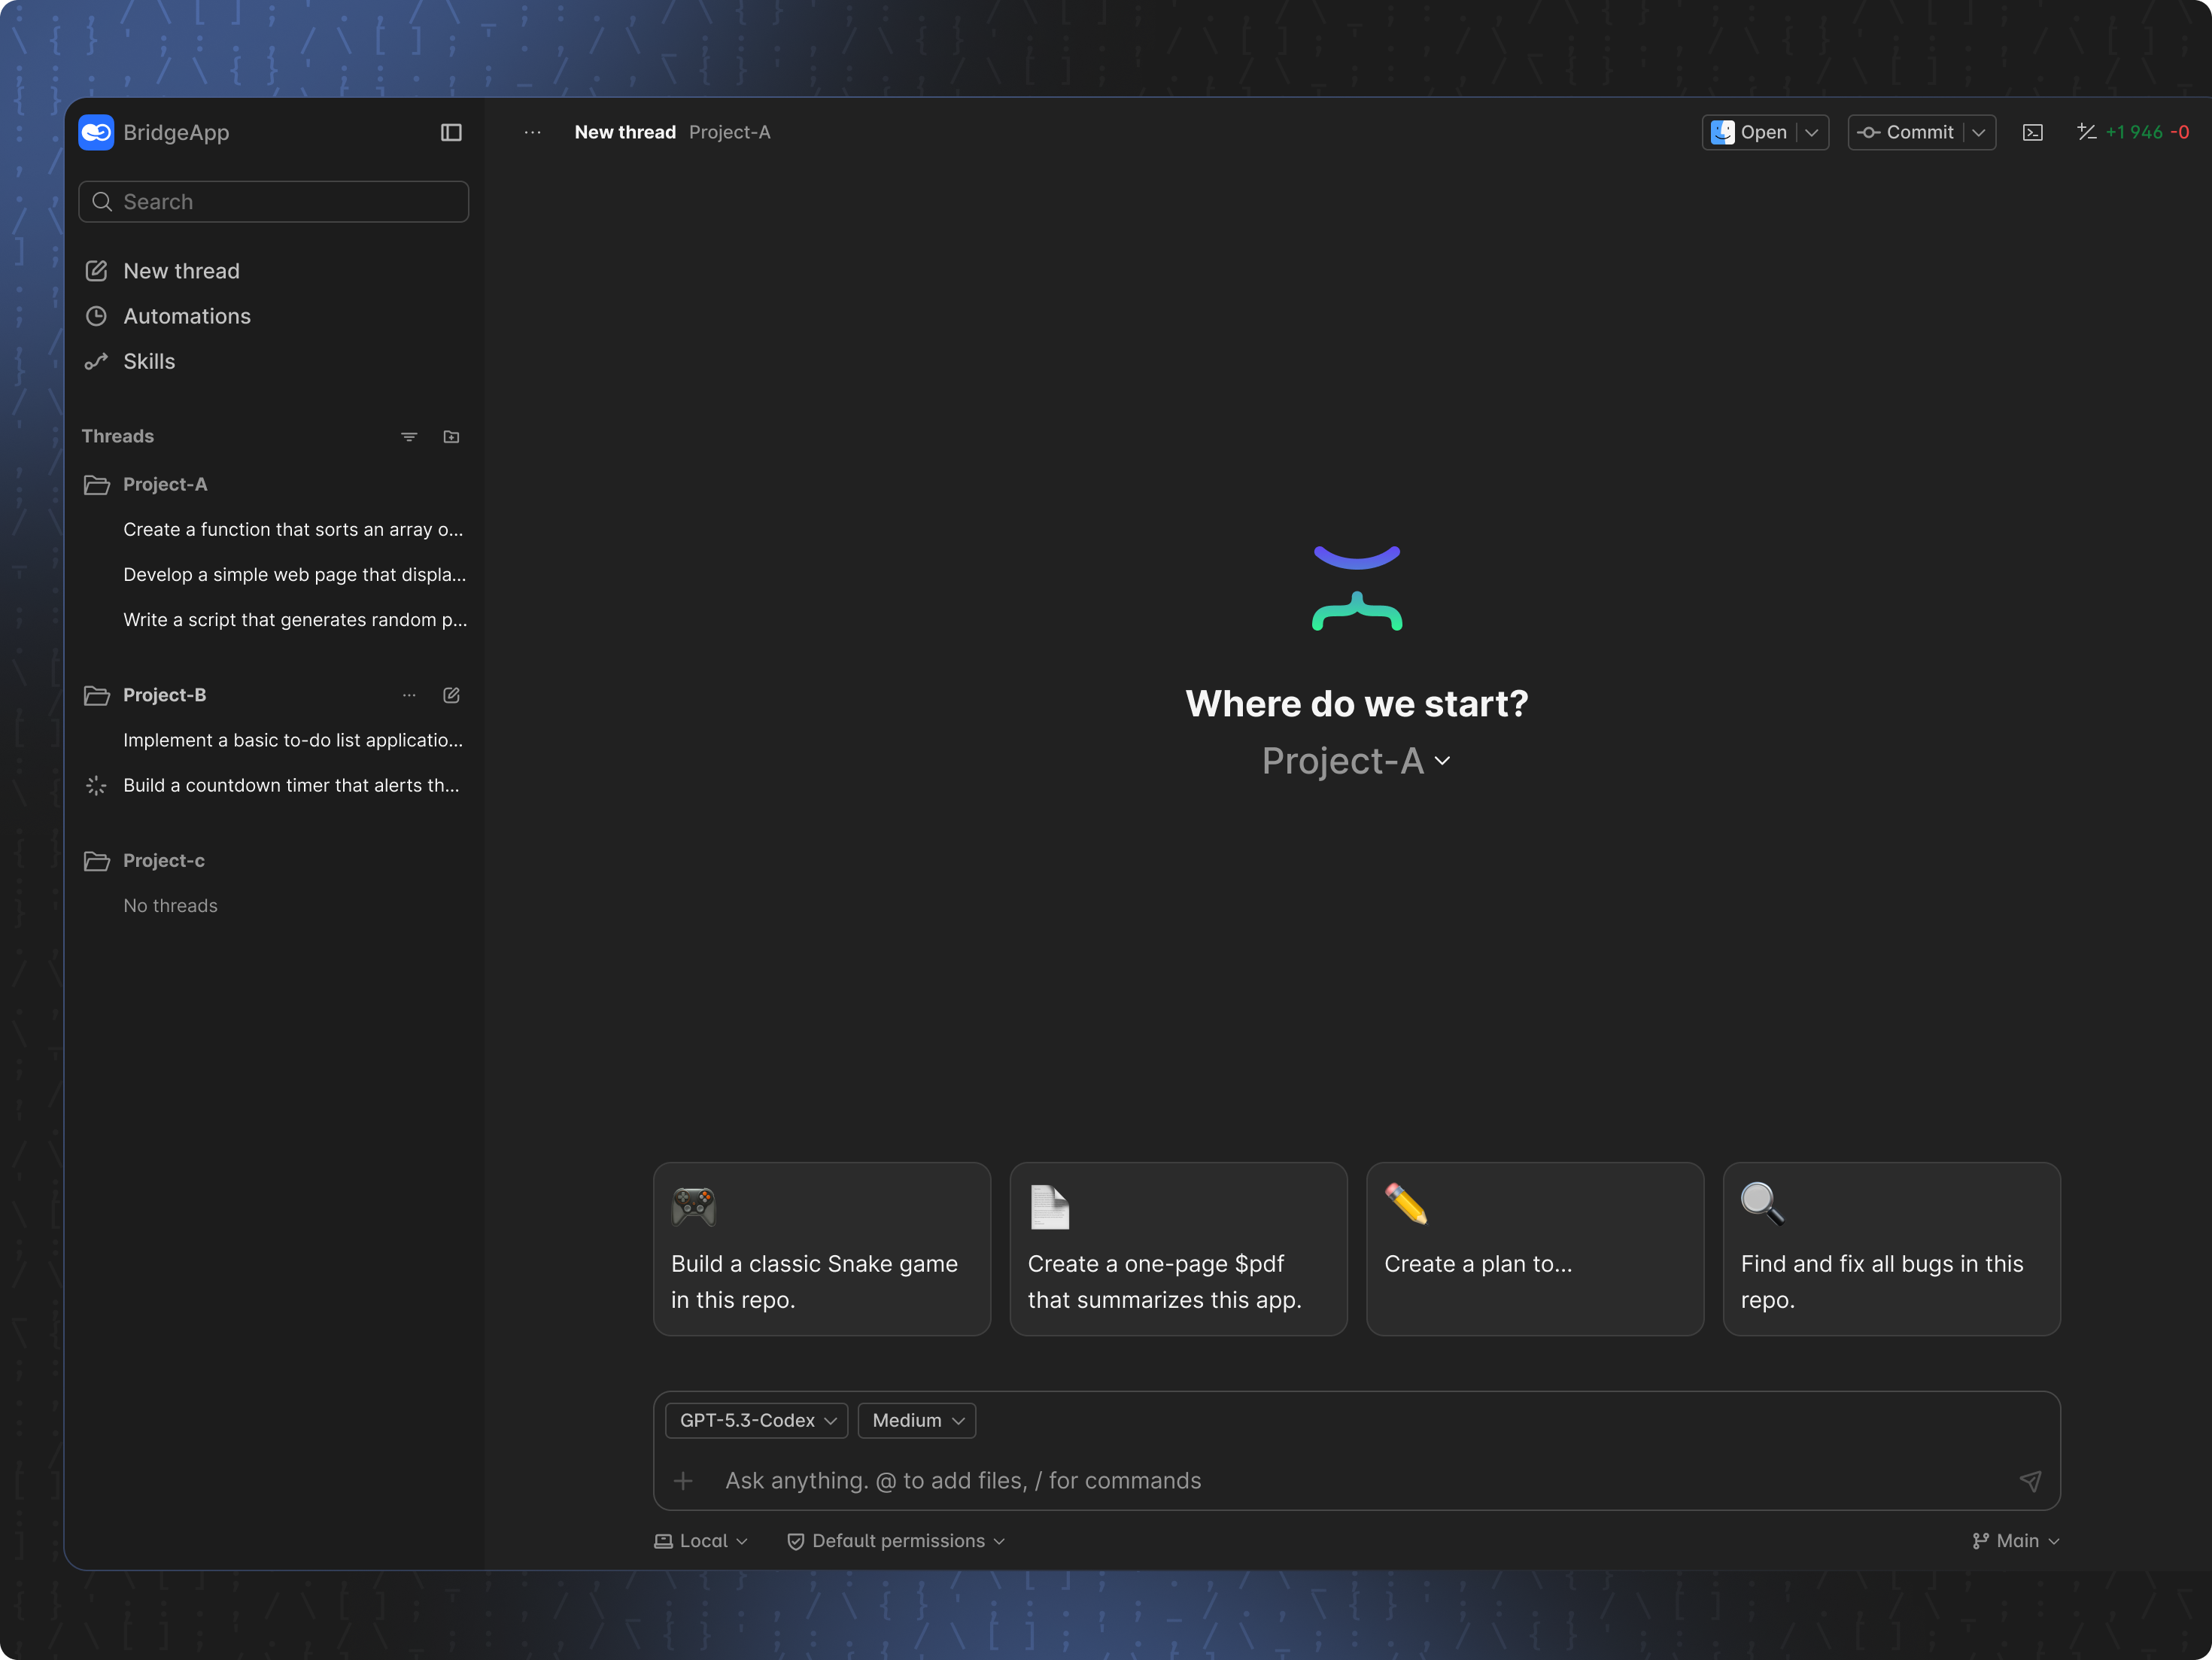
The typical multi-agent pipeline in BridgeApp mirrors professional debugging workflows:
- A Team Lead agent triages incoming bug reports and assigns priority
- A System Architect agent inspects the codebase and authors a debugging strategy as a linked document
- Developer agents apply and test code changes according to the approved plan
- A Code Reviewer agent checks patches against the original plan and flags blocking issues
Platform capabilities particularly relevant to automated debugging include orchestration of long-running flows with durable state and crash recovery, secure execution sandboxes via isolated microVMs, codebase intelligence graphs that trace callers and call chains across services, and per-agent memory that retains context from recurring issues.
The critical guardrail: BridgeApp's automated debugging flows intentionally stop at a "waiting for merge" state. Agents never advance a task to done. A human engineer always decides what reaches production. This is the "human reviews the plan, system reviews the implementation" design that makes automation trustworthy for professional teams.
Challenges and Limitations of Automated Debugging
Despite the promise, automated debugging still faces practical and research challenges. An honest assessment is essential for teams considering adoption.
Technical issues:
- Flaky tests undermine both fault localization and patch validation. If a test fails intermittently regardless of code changes, automated systems waste cycles chasing phantoms.
- Increased software complexity presents roadblocks for automated debugging tools, particularly deeply concurrent or real-time computer programs.
- Incomplete observability data means the system cannot see what it needs to diagnose. Missing traces and logs create blind spots.
- Limited support for legacy or niche programming languages remains a gap; most tools are benchmarked on Java or Python.
- Automated debugging struggles with measurable effectiveness in complex scenarios spanning multiple files or services.
Organizational issues:
- Integrating automated debugging with existing tools is often challenging, especially in legacy pipelines with custom build systems.
- Automated debugging tools face maintenance issues due to multiple dependencies on specific tool versions, APIs, and configurations.
- Training developers to interpret automated outputs and to identify errors in machine-generated patches takes time.
Measurement challenges include defining metrics for debugging quality, tracking false positives versus missed defects, and comparing automated versus manual approaches fairly. Teams should treat automated debugging as an evolving capability rather than a one-time purchase, with regular reviews and continuous improvement cycles.
Future Directions in Automated Debugging
The trajectory from 2023 to 2030 points toward larger multimodal models that combine code, logs, stack traces, and metrics with stronger reasoning. Standardized debug protocols and unified representations of bugs and test failures will enable better tool chaining and agent orchestration.
Research frontiers include deeper integration of domain specifications into automated reasoning, better handling of concurrency across programming languages, and cross-language debugging for polyglot distributed systems. Symbolic execution combined with LLM reasoning could address classes of bugs that neither approach handles well alone.
Big data and long-term telemetry archives will allow automated systems to learn from thousands of past incidents, predicting and preventing failures rather than just reacting. AI-driven debugging tools will increasingly predict potential issues in new code commits before they manifest as production incidents.
UX innovations are coming: IDE-embedded scientific debugging timelines, natural-language queries like "why did this fail yesterday but not today?", and collaborative debugging sessions with AI co-facilitators. These will make advanced debugging features accessible to engineers who are not debugging specialists.
Platforms that unify orchestration, agent collaboration, and observability, like BridgeApp, are well-positioned to host these next-generation automated debugging workflows. The combination of multi-agent pipelines, codebase intelligence, and human-in-the-loop governance provides the foundation on which future debugging capabilities will be built.
Practical Adoption Checklist
Here is a concise, action-oriented checklist for teams starting with automated debugging:
- Inventory your current debugging tools, test scripts, and ad-hoc scripts; identify gaps
- Standardize your bug report template to include environment, reproduction steps, logs, and links to failing tests
- Prioritize your top three debugging pain points by time cost and frequency
- Run a pilot with one service or module, measuring impact on MTTR and developer time
- Choose initial dynamic analysis tools and static code analyzers appropriate for your stack
- Define review policies for automated patches: who reviews, what thresholds trigger human attention
- Set specific, time-bound goals, such as reducing average bug reproduction time by 30% within one quarter
- Document both successes and failures of automations, feeding learnings back into platform-level knowledge bases and agent memory where possible
- Organizations adopting BridgeApp or similar platforms should start with a narrow, high-value flow like CI regression triage before scaling to broader automated debugging coverage
Conclusion
Automated debugging has evolved from isolated scripts and academic prototypes into practical, explainable, LLM-enhanced systems embedded in everyday development workflows. What began as spectrum-based fault localization and delta debugging in research labs is now available as integrated pipelines that read code, run experiments, generate patches, and explain their reasoning in natural language.
The scientific debugging mindset, where hypothesis meets experiment meets evidence, remains the gold standard for resolving bugs. Explainability and human oversight are not optional extras but foundational requirements for teams operating in production environments at scale. Dynamic analysis, execution synthesis, and modern code analysis tools provide the raw data that makes serious automation possible. Automated debugging tools can significantly reduce debugging time while maintaining the quality and safety standards that professional software development demands.
Engineering leaders should view automated debugging as a strategic capability, not a convenience feature. In large-scale distributed systems, it is the difference between hours of manual debugging and minutes of structured, evidence-based resolution. Explore platforms like BridgeApp to design custom, multi-agent automated debugging pipelines aligned with your stack, governance needs, and business goals.
FAQ
How is automated debugging different from traditional test automation?
Test automation focuses on running predefined test cases and reporting pass or fail status. Automated debugging goes further: it focuses on understanding and resolving the underlying causes of failures. Automated debugging may invoke tests, profilers, dynamic analysis tools, and debuggers to localize faults, generate hypotheses, and even propose patches. In mature setups, both work together: failing tests automatically trigger debugging workflows that gather more data and suggest next steps. Think of test automation as the alarm and automated debugging as the investigation that follows.
Can automated debugging safely modify production systems?
In most professional environments, automated systems do not directly change production code. They propose patches and configuration changes for human review. Fully automated fixes may be acceptable in low-risk areas such as feature flags or non-critical services, but they should be guarded by strict regression tests and rollout controls. BridgeApp's "waiting for merge" design is a good example of how platforms enforce safe boundaries: debugging agents do their work but stop before anything is deployed, leaving the final decision to a human reviewer.
What skills do developers need to work effectively with automated debugging systems?
Key skills include a solid understanding of debugging fundamentals and debugging techniques, the ability to interpret dynamic analysis reports, familiarity with CI/CD pipelines and development workflows, and comfort reading AI-generated explanations critically. Software developers should also learn how to write high-quality bug reports and targeted tests, since these artifacts are the main inputs automated systems use. Cross-training in observability tools and scripting to customize and extend debugging automations is valuable as engineers move along the development lifecycle.
How do automated debugging systems handle noisy logs and flaky tests?
Advanced automated systems use statistical techniques and historical data to identify recurring patterns and distinguish signal from noise in logs and telemetry. For flaky tests, strategies include quarantine lists, repeated runs, and heuristics that down-weight unreliable tests in fault localization and repair decisions. However, automated debugging is only as good as the data it receives. Teams should continuously improve test reliability and logging quality as a prerequisite for effective automation. Errors happen in any system, but consistent signal quality makes it far easier for automation to detect issues accurately.
Is automated debugging suitable for small teams and startups?
Even small teams benefit from lightweight automation debugging, such as CI-driven static and dynamic analysis, log correlation, and IDE-integrated LLM assistants. Startups should start small, automating regression triage or log analysis first, before investing in complex multi-agent debugging workflows. The goal is to stop program execution at the right moment, identify the issue, and fix it quickly without requiring a large infrastructure investment. Platforms like BridgeApp can help small teams quickly assemble tailored debugging agents without building all orchestration and governance from scratch, enabling them to punch above their weight in software quality and resolving bugs efficiently.