BlogIndustry Insights
Essential Debugging Tools for Efficient Software Development

BridgeApp Team
15 min read

Every software engineer has stared at a failing build, a cryptic stack trace, or a production incident at 2 a.m., wondering where things went wrong. The difference between a 20-minute fix and a two-day investigation usually comes down to the debugging tools and process you bring to the problem. This guide covers the full landscape of modern debugging tools in 2026-from interactive debuggers and static analysis to AI-assisted platforms-so you can find and fix defects faster, regardless of your stack.
Key Takeaways
- Modern debugging tools-debuggers, code analysis tools, profilers, logging, and automated testing-work together in a repeatable debugging process that isolates the root cause of defects quickly.
- Poor debugging practices lead to reliability failures, security vulnerabilities, data loss, and damaged user experience; a structured approach reduces time-to-resolution and prevents recurrence.
- Debugging tools span every major programming language and integrated development environment, including IntelliJ IDEA, Visual Studio Code, Xcode, and Android Studio.
- Advanced techniques like remote debugging, post-mortem analysis, and time-travel debugging solve problems that basic stepping and print statements cannot.
- AI-assisted platforms such as Magic Coder by BridgeApp can automate repetitive debugging tasks and accelerate the entire debugging process without replacing human judgment.
What Is Debugging?
Debugging is the process of identifying and fixing bugs in code so that software programs behave as intended. It goes well beyond making an error message disappear-effective debugging means understanding the root cause of a defect and preventing it from recurring.
Debugging covers several distinct error types:
- Syntax errors occur due to missing code elements like parentheses, semicolons, or incorrect indentation. Your compiler or interpreter catches these before the program runs.
- Semantic errors violate coding language rules without meaningful output-code that compiles but produces something other than what you intended (e.g., using integer division when you needed floating-point).
- Logical errors produce incorrect outputs despite correct syntax. A classic example: a Java method meant to return the maximum of two values that accidentally returns the minimum because the comparison operator is reversed.
- Runtime errors happen during application execution or startup-null pointer exceptions, divide-by-zero, or out-of-bounds access that crash the process.
The debugging process typically combines several methods: interactive debuggers, code analysis tools, print debugging, structured logging, tracing tools, and automated testing. Most developers reach for a mix of these depending on the bug's complexity, the development environment, and the programming languages involved.
Why Is Debugging Important?
Undetected bugs lead to crashes, data loss, performance degradation, and security vulnerabilities. A race condition in a web service can take down a production environment for hours. Buffer overflows and SQL injection flaws-both fundamentally debugging failures-remain among the most exploited security vulnerabilities in 2026.
The business impact is equally concrete. Bugs harm user experience, inflate support costs, and erode a company's reputation. Development teams that lack a structured debugging workflow spend more time on hotfixes and rollbacks, which means slower feature delivery and higher operational costs.
Why is debugging important beyond fixing the immediate symptom?
- A structured approach (reproduce → isolate → find root cause → fix → validate → document) measurably reduces time-to-resolution and prevents repeated incidents.
- Debugging deepens developers' understanding of the codebase, libraries, and language features-leading to more maintainable software over time.
- Integrating debugging with code review, continuous integration, and automated testing improves stability across the entire development lifecycle.
Debugging can be time-intensive and complex, but the alternative-shipping fragile code-is far more expensive.
How the Debugging Process Works
A good debugging process involves reproducing, isolating, observing, hypothesizing, testing, and fixing issues. Here is how that looks in practice:
- Reproduce the issue. The first step in debugging is reproducing the conditions that caused the bug. Without a reliable reproduction, you are guessing.
- Capture context. Collect logs, inputs, environment details, and error reports. Centralized logging and tracing tools are critical here.
- Narrow down the suspect area. Use divide-and-conquer or backtracking to isolate which module, function, or service is responsible.
- Identify the root cause. Attach a debugger, inspect a program's state, examine variables, and evaluate hypotheses about why the bug occurs.
- Implement and verify a fix. Write a targeted fix, then validate it with tests. Documenting the debugging process helps in managing future bugs effectively.
Debugging can be time-intensive and involves several iterative processes. In large distributed systems, the process often spans multiple services, containers, or cloud environments and requires structured observability and remote debugging support.
Classic techniques used at each step include cause elimination (ruling out possibilities systematically), rubber-duck explanations (verbalizing the problem to expose assumptions), and divide-and-conquer (bisecting the codebase or input to narrow the fault location).
Core Categories of Debugging Tools
Debugging tools solve different kinds of problems, so no single tool covers every scenario. The main families include:
- Interactive debuggers – pause program execution, set breakpoints, step through source code, inspect variables.
- Logging and tracing tools – record events during program execution for offline or real-time analysis.
- Static code analysis tools – find bugs without running code by scanning source code for patterns, style violations, and potential errors.
- Dynamic analysis tools and memory debuggers – observe runtime behavior, detect memory leaks, race conditions, and buffer overflows.
- Performance profilers – measure CPU usage, memory usage, I/O waits, and identify performance bottlenecks.
- Automated testing frameworks – unit, integration, and end-to-end tests that catch regressions before bugs reach production.
Static tools analyze code without executing it, making them fast and suitable for CI pipelines. Dynamic tools instrument or observe a running program, revealing issues that static analysis cannot detect-at the cost of runtime overhead. Many integrated development environments bundle both approaches behind a unified interface, often tailored per programming language. Command line tools like gdb, jdb, and lldb remain essential for low-level or headless environments where GUIs are unavailable.
Interactive Debuggers and IDE Debugging Features
A debugger helps understand why a specific execution is wrong. Interactive debuggers pause execution and allow inspection of program state-letting you set breakpoints, step through code line by line, and watch how variables change.
Key features of interactive debuggers include breakpoints and variable inspection:
- Breakpoints and conditional breakpoints – halt execution at a specific line, or only when a condition is met.
- Stepping – step into, step over, and step out of function calls to trace program execution.
- Watch expressions and call stack inspection – monitor values and see the chain of calls that led to the current point.
- Expression evaluation – test hypotheses by evaluating code on the fly.
Developers often use debugging tools to inspect variables and step through code across every major environment:
- IntelliJ IDEA features inline debugging for Java applications (and Kotlin, Scala, Groovy), with conditional breakpoints, thread views, and remote debugging.
- Visual Studio Code supports debugging for multiple languages-JavaScript, TypeScript, Python, Go, C++-via the Debug Adapter Protocol.
- Xcode Debugger integrates with the editor for Swift development, backed by LLDB, and includes memory and performance instruments.
- Eclipse IDE includes built-in debugging tools for Java, integrating with the Java Development Toolkit for breakpoints, watches, and hot code replacement.
- Android Studio provides a full debugger for Kotlin and Java development on Android, with memory and layout profilers.
- PyCharm Debugger allows setting breakpoints and inspecting variables, supporting step-through debugging for Python code.
For standalone debuggers, the GNU Debugger (gdb, now at version 16.x) supports reverse execution, DWARF5, and Python scripting. LLDB 19.x is the default on Apple platforms and supports the Debug Adapter Protocol. These command line tools are critical when debugging containers, servers, or embedded systems in a headless development environment.
Modern IDEs also provide remote debugging capabilities, allowing you to attach to processes running on staging or production servers over a secure connection-a feature covered in detail later.
Logging, Tracing, and Print Debugging
Print debugging involves inserting print statements in code-print(), console.log(), System.out.println()-to observe values at specific points. It is appropriate for quick local experiments and simple scripts, but becomes problematic in complex or concurrent systems where output is noisy, interleaved, and hard to filter.
Structured logging is the scalable alternative. Logging tools record events during program execution with levels (INFO, WARN, ERROR), timestamps, request IDs, and structured metadata. Logging utilities analyze a program's state at various code points, making it possible to trace behavior without attaching a live debugger. Centralized logging enhances visibility into application behavior and issues in production, and logging can be used to track down issues in production environments where interactive debugging is not an option. Logging can also help diagnose complex or recurring problems that only surface under real-world load.
Common logging frameworks by language:
- Python: built-in logging module, structlog
- Java: log4j, logback via SLF4J
- JavaScript/Node.js: Winston, Pino, Bunyan
For distributed systems, tracing tools extend logging across service boundaries. Distributed tracing records events across services to analyze request flow, using concepts like spans, correlation IDs, and trace contexts. Tools like OpenTelemetry, Jaeger, and Zipkin let you follow a single user request through multiple microservices and pinpoint exactly where latency spikes or errors occur.
The rule of thumb: use print statements for throwaway exploration, structured logging for anything that runs in staging or production, and distributed tracing when your system spans multiple services.
Static Code Analysis and Code Analysis Tools
Static code analysis tools find bugs without running code. They examine source code to detect potential bugs, security vulnerabilities, code smells, and style violations early in the development cycle. Static analyzers evaluate source code without executing it to find bugs-making them fast, repeatable, and ideal for CI integration.
How compilers and linters serve as first-line static analyzers:
- GCC/Clang warnings catch unused variables, type mismatches, and potential errors in C/C++.
- ESLint enforces coding standards and catches issues in JavaScript/TypeScript.
- Pylint and Flake8 analyze Python source code for bugs and style.
- Clang-Tidy checks C++ code for correctness, performance, and maintainability patterns.
Dedicated code analysis tools go further. SonarQube integrates into CI/CD pipelines for early bug detection, scanning across multiple programming languages and enforcing rules at the organization level. Static code analysis detects vulnerabilities based on predefined rules-covering categories like:
- Correctness: null dereferences, uninitialized variables, unreachable code
- Security: injection risks, buffer overflows, tainted data flows
- Maintainability: overly complex functions, dead code, duplication
- Performance: inefficient patterns, unnecessary allocations
Static analysis tools improve code quality and maintainability, but they complement rather than replace dynamic debugging. They cannot catch issues that depend on runtime state, actual data, or timing.
Dynamic Analysis, Memory Debuggers, and Performance Profilers
Dynamic analysis observes and instruments programs while they are running to detect issues that static analysis might miss-memory leaks, race conditions, buffer overflows, and performance bottlenecks.
Memory debugging:
- Memory debuggers detect memory leaks and buffer overflows by tracking memory allocations and deallocations throughout program execution.
- Sanitizers can detect invalid memory usage during compilation and runtime. AddressSanitizer catches out-of-bounds access and use-after-free; ThreadSanitizer detects data races in concurrent code.
- Valgrind is a popular tool for memory debugging on Linux, providing detailed reports of memory errors and leaks.
- Memory debuggers help ensure effective use of system resources, which matters in performance-sensitive systems like financial trading or real-time graphics.
Performance profiling:
- Performance profilers track CPU bottlenecks and memory usage for optimization. Profilers measure CPU usage and resource consumption in applications, revealing which functions consume the most wall-clock time.
- Profilers better understand where problems originate at scale before execution reaches the user. Tools include Java Flight Recorder (JFR), VisualVM, dotTrace for .NET, and built-in profilers in IntelliJ IDEA.
- A typical scenario: an API server degrades under load. A profiler reveals one function responsible for 70% of CPU time due to a blocking I/O call-something no amount of code reading would surface quickly.
Concurrency analysis:
- Race conditions and deadlocks only appear under specific timing. Dynamic tools like ThreadSanitizer help detect concurrency problems that are otherwise nearly impossible to reproduce consistently.
- For the hardest cases-heisenbugs that disappear when you try to observe them-time-travel debugging tools like rr and Replay.io record a full execution and let you step both forward and backward to find the fault.
Automated Testing and the Role of Unit Tests in Debugging
Automated testing helps prevent introducing new bugs during fixes. It works hand-in-hand with debugging by providing fast feedback on whether a defect has been resolved and by catching regressions before they reach users.
Test-Driven Development involves writing tests before code-forcing clarity on expected behavior and producing a minimal failing test case that reproduces the bug and proves the fix works. Unit tests can help identify bugs and unexpected behaviors early, while integration and end-to-end tests validate broader system interactions.
Key frameworks by ecosystem:
- Java: JUnit, TestNG
- Python: pytest, unittest
- JavaScript/TypeScript: Jest, Mocha
- C++: Google Test
Code coverage tools like JaCoCo (Java), Istanbul/NYC (JavaScript), gcov (C/C++), and Coverage.py (Python) expose untested paths that often hide production bugs.
Continuous integration runs automated tests after every commit, ensuring that new changes do not break existing behavior. Automated testing improves application quality and debugging efficiency, but it does not replace debugging tools-it reduces the number of defects that require debugging in the first place.
Remote, Post-Mortem, and Distributed Debugging
Remote debugging allows debugging on a different system-attaching a debugger to an application running on another machine via a network connection, often with port forwarding and secure tunnels. It is essential for issues reproducible only on remote machines, such as environment-specific configurations or hardware differences. Both computers must have the debugger installed for remote debugging to work, and firewalls may need configuration to enable remote debugging. Remote debugging is useful for applications on remote servers, Kubernetes pods, or physical mobile devices connected to a development workstation.
Post-mortem debugging analyzes crash dumps, core dumps, or error reports after a program has terminated. WinDbg analyzes crash dumps on Windows systems. On Linux/macOS, gdb and lldb can load core files for inspection. JVM heap dump analyzers and crash reporting services like Sentry provide structured post-mortem data. Error tracking tools capture exceptions and provide context for debugging, making it easier to understand what happened before the crash.
Distributed debugging relies on logs, metrics, traces, and correlation IDs to follow a request across microservices, queues, and databases. Classic single-process stepping is not enough when a bug spans multiple services. Observability platforms like Datadog, Honeycomb, and Jaeger tie together error tracking, metrics, and traces for a unified view.
Setup considerations: exposing debug ports is a security risk-always use authenticated tunnels. Verbose logging in production increases overhead and may capture sensitive data. Plan retention and access policies accordingly.
Choosing the Right Debugging Tool for Your Stack
Start from your programming language and runtime, then layer in constraints like environment, performance impact, and team familiarity:
- Java development: IntelliJ IDEA or Eclipse Debugging Tools for local work; JFR and VisualVM for profiling; jdb for command line access in containers.
- Python: VS Code or PyCharm Debugger for step-through debugging; pdb for headless environments; pytest for test-driven debugging.
- JavaScript: Chrome DevTools allows real-time inspection of web applications. Browser DevTools debug frontend code and inspect various web elements, with key features including DOM inspection and network monitoring. VS Code handles Node.js debugging.
- C/C++: gdb or lldb from the command line; Visual Studio on Windows with ReSharper, which enhances debugging in Visual Studio with real-time suggestions; AddressSanitizer for memory issues.
- Swift/Kotlin: Xcode for Swift on Apple platforms; Android Studio for Kotlin.
The most effective development teams combine tools: static code analyzers in CI, IDE debugging locally, and logging plus tracing in staging and the production environment. They standardize on a small, well-understood toolset per language and document common debugging playbooks for the organization-covering how to switch threads, inspect CPU registers, and analyze large code bases methodically.
Integrate your debugging tools into the wider toolchain: version control, issue trackers, CI/CD pipelines, and monitoring. The shorter the feedback loop between a bug occurring and a developer seeing it, the faster bugs get fixed.
How AI and Automation Are Changing Debugging (Including BridgeApp)
Since roughly 2023, AI-assisted debugging tools have moved from research prototypes to daily-use developer tools. They analyze large codebases, suggest potential root causes, generate candidate fixes, and write regression tests automatically. Research like DoVer from Microsoft demonstrates that AI intervention can convert 18–28% of previously failed debugging runs into successes in multi-agent systems.
Typical capabilities of modern AI coding assistants include summarizing stack traces, proposing minimal reproductions, scanning repositories for similar failure patterns, and integrating with command line tools and CI logs. Tools like DebugMate use organizational context-codebase structure, internal documentation-to suggest root causes that are specific to your system rather than generic.
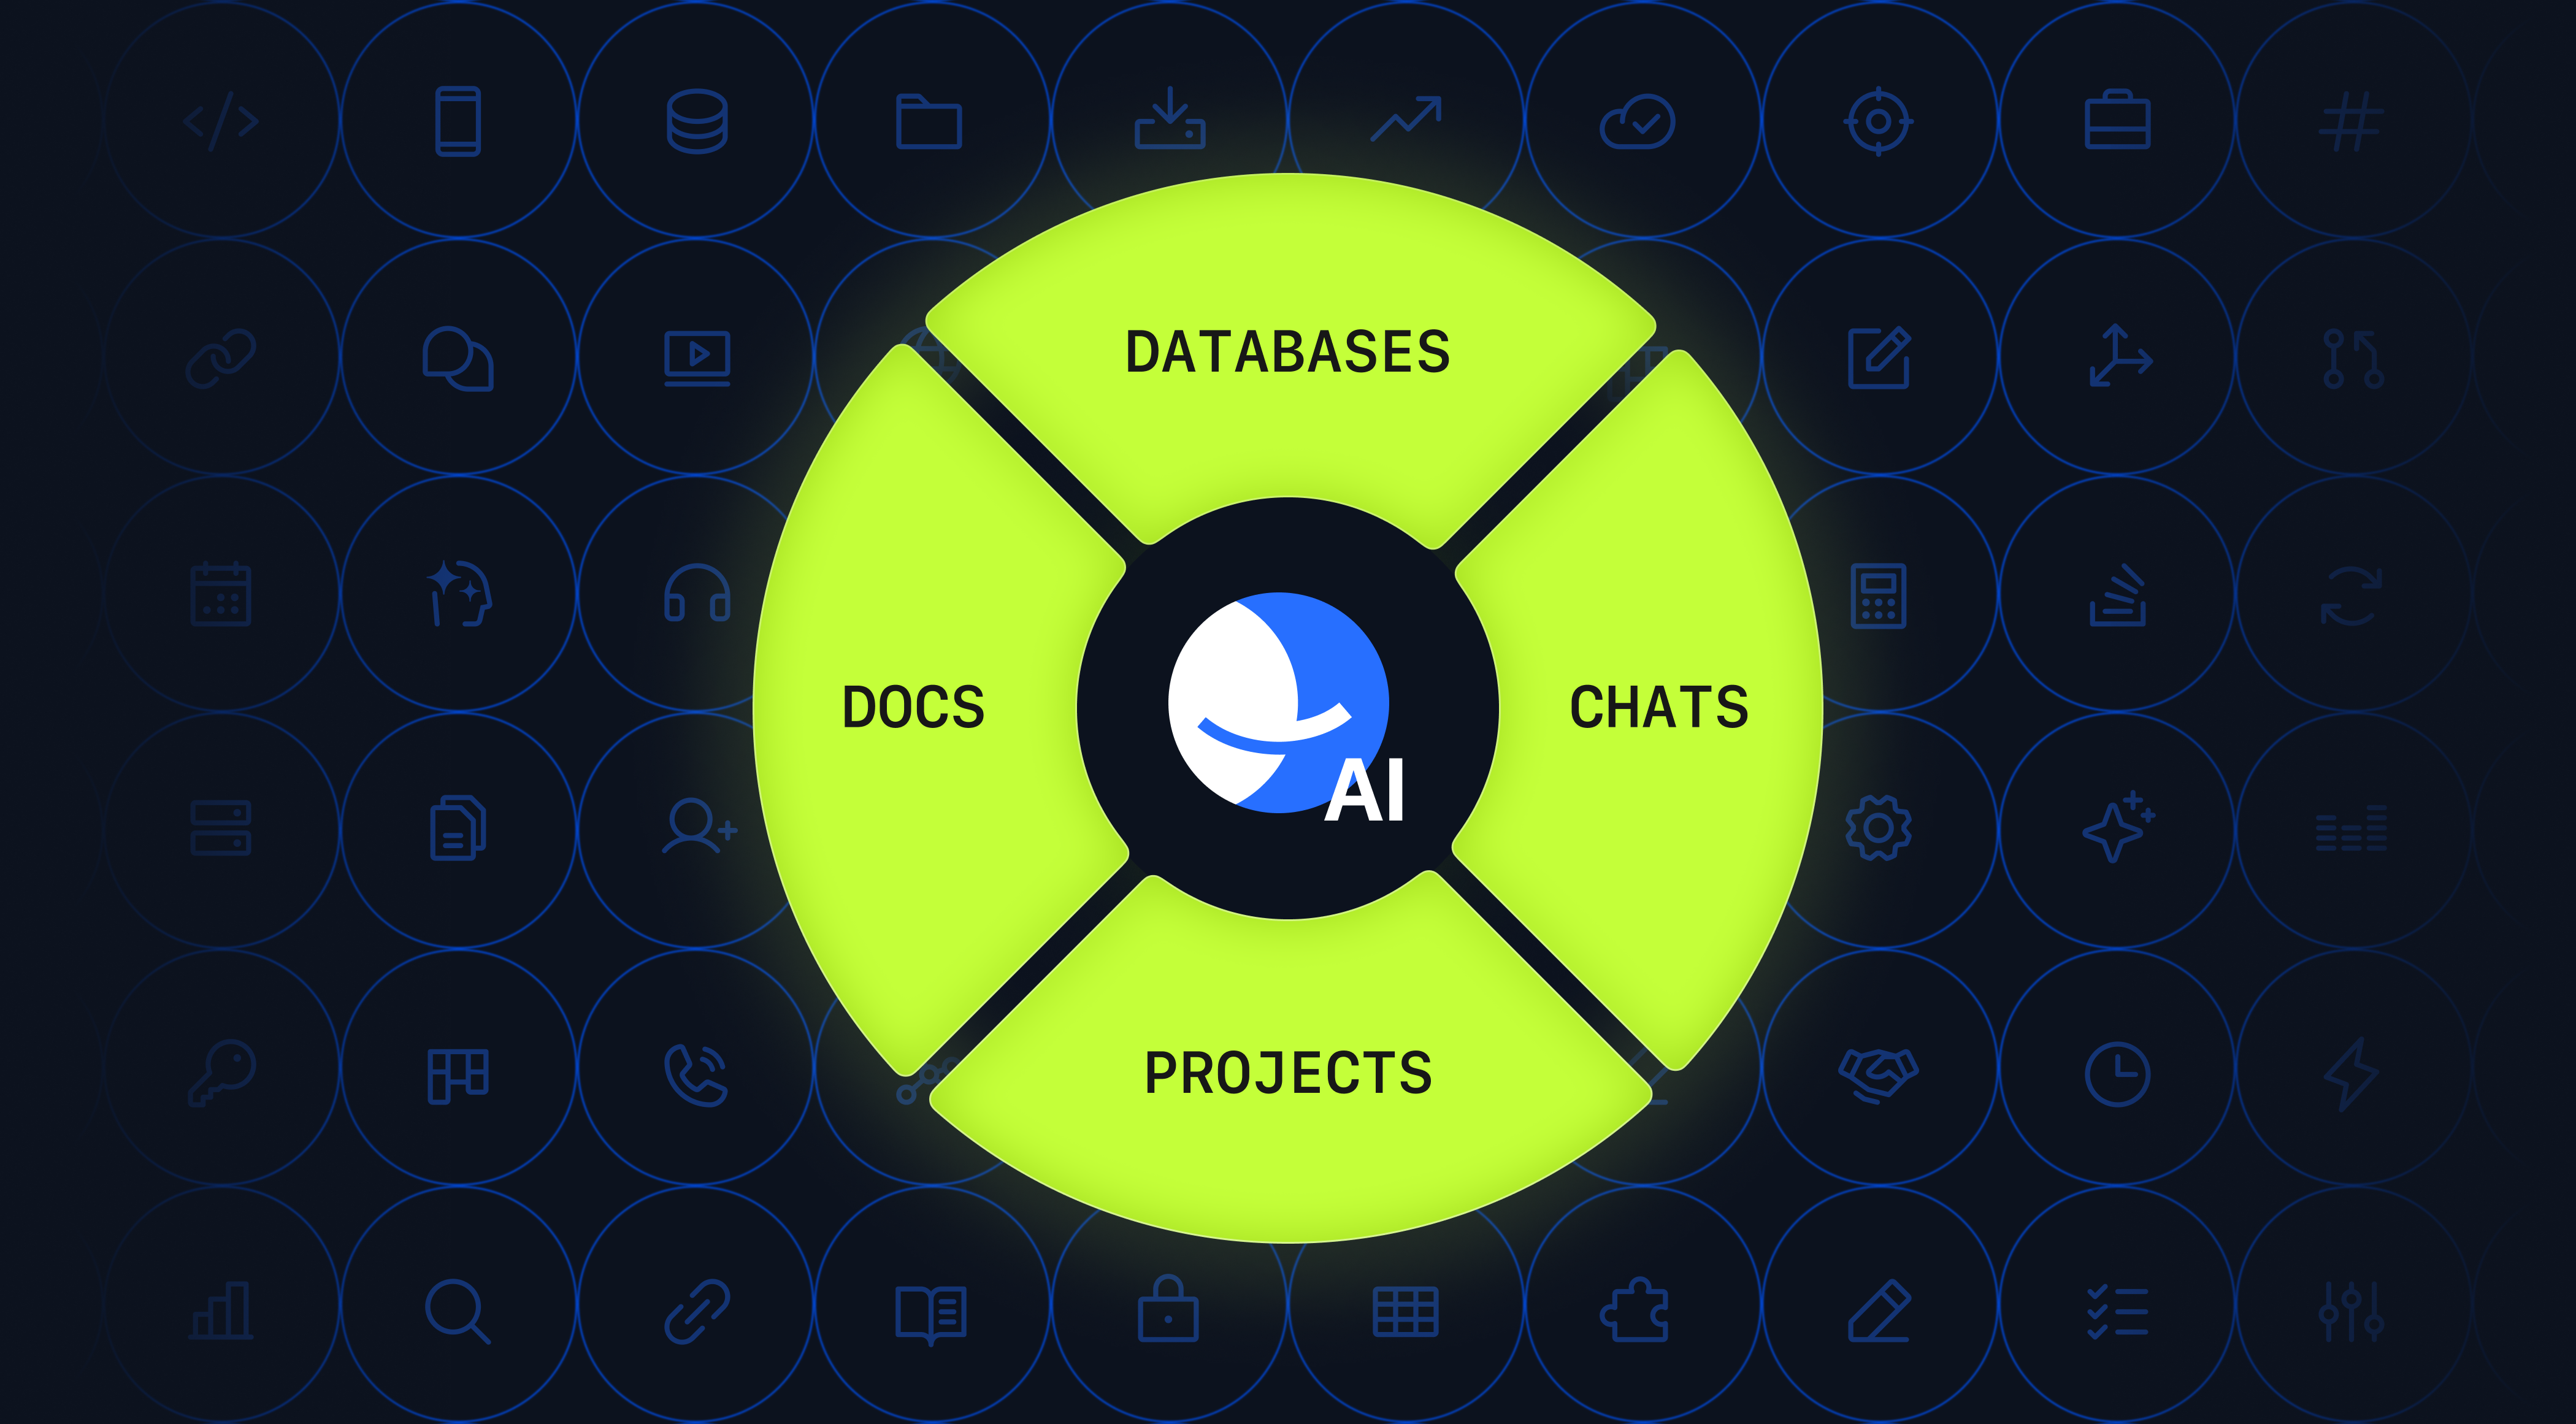
Magic Coder by BridgeApp is an example of an AI-driven debugging companion built into a broader workspace. It understands your repository structure through codebase intelligence (code graphs, call chains, cross-service traces), can call terminal-based tools directly, and helps orchestrate multi-step debugging tasks while keeping humans in control. Within BridgeApp, debugging work connects to Projects, Documents, and chat threads-so context like logs, hypotheses, and attempted fixes is preserved and searchable for future incidents. The platform uses isolated secure execution environments and scoped credentials, which matters when you need AI agents interacting with production data or sensitive codebases.
Specialized tools and AI-powered platforms augment software engineers' problem-solving skills: they speed up code analysis, automate repetitive tasks, create additional features for navigating other languages and unfamiliar systems, and suggest fixes. But final decisions remain with human developers-technically correct suggestions still require human review to ensure they are actually correct for your context. Developing code with AI assistance does not mean abdicating responsibility for overall performance and correctness.
FAQ
Which debugging tool should I learn first as a new developer?
Start with the debugger in your primary IDE-IntelliJ IDEA for Java or Kotlin, Visual Studio Code for JavaScript/TypeScript or Python, or Xcode for Swift. These combine breakpoints, watches, and call stack inspection in one place. Pair this with basic print debugging and logging so you learn both interactive and non-interactive techniques early. Most developers find that mastering their IDE's built-in debugger covers 80% of everyday debugging needs.
How do debugging tools differ between programming languages?
Concepts like breakpoints, stepping, and variable inspection are universal, but implementations differ by runtime. JVM debuggers (used in Java development and Kotlin) operate at the bytecode level with features like hot code replacement. CPython's pdb works at the interpreter level. Browser DevTools for JavaScript offer DOM inspection and network monitoring alongside standard stepping. Choose tools native to your programming language ecosystem-they integrate better with build systems, test frameworks, and the operating system you deploy to.
What is the difference between debugging and automated testing?
Debugging is an investigative activity performed after detecting a failure-you are actively looking for why a bug occurs. Automated testing is a preventive practice that continuously checks behavior to catch regressions early. Unit testing catches issues at the function level; integration tests verify system interactions. Effective teams use both: tests to continuously validate, and debugging tools to understand and correct issues that slip through.
Can I rely only on print statements instead of a debugger?
Print debugging is useful for simple scripts or when specialized tools are unavailable. But it becomes inefficient in complex, concurrent, or distributed systems-output is noisy, time consuming to filter, and you risk leaving debug print statements in production source code. Combining print statements with proper logging frameworks and an interactive debugger gives you far deeper insight without cluttering the codebase.
How can AI tools like Magic Coder by BridgeApp help with legacy or large codebases?
AI-assisted tools can quickly scan large repositories, build an internal model of modules and dependencies, and answer questions about where a bug might originate or how a function is used across the codebase. Magic Coder by BridgeApp leverages codebase intelligence to map call chains and cross-service traces, helping software engineers navigate unfamiliar or legacy systems much faster. Combined with traditional debugging tools and good tests, AI keeps all debugging steps transparent and reviewable-so you resolve issues efficiently without losing the audit trail.